How to Analyze Charts with ChartLense
Now that you're registered, here's how to start analyzing trading charts with advanced technical analysis.
See ChartLense in Action
Watch this quick demo showing ChartLense analyzing an NVIDIA chart in real-time:
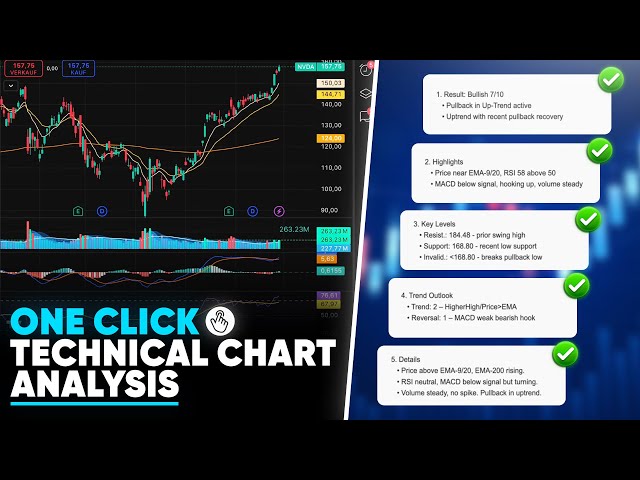
This demo shows the complete analysis process from one click to comprehensive results. For detailed explanations of each analysis section, see Understanding Your Chart Analysis. Want to understand confidence scores? Check out How AI Confidence Works.
Advanced Feature: Once you're comfortable with basic analysis, you can customize what the AI focuses on using Expert Prompts—perfect for traders who want analysis tailored to specific indicators or strategies.
Quick Start
Step 1: Navigate to Your Chart
Go to your preferred trading platform and open the chart you want to analyze.
Step 2: Open ChartLense
Click the ChartLense icon ![]() in your Chrome toolbar to open the sidebar.
in your Chrome toolbar to open the sidebar.
Step 3: Start Analysis
Click the "Analyze this chart" button to get instant technical analysis.
Get the Best Analysis Results
The quality of your analysis depends on screenshot quality. For detailed tips on chart preparation, zoom levels, and indicator visibility, see our comprehensive guide:
→ Getting Better Results - Learn how to prepare charts for optimal analysis
TradingView Users: Use the ChartLense Dashboard
The ChartLense Dashboard is a free Pine Script indicator that automatically formats chart data for optimal analysis. This is the most reliable way to ensure high-quality results on TradingView.
Why use it?
- Automatically displays key indicators in a clean table format
- Ensures the AI can read precise numerical values
- One-click setup, works alongside your existing indicators
Using the Blackout Tool:
For privacy protection, ChartLense includes tools to hide sensitive information from analysis. Learn more in our detailed Privacy Settings Guide.
Supported Trading Platforms
ChartLense works with all major trading platforms including TradingView, StockCharts, ProRealTime, and Yahoo Finance. The extension can also learn new platforms dynamically and analyze saved chart screenshots.
→ View Full Platform List - See all supported platforms, compatibility details, and setup instructions
Need Help?
- Can't see the extension? Check installation of ChartLense Extension.
- Analysis not working? Check Chrome permissions
- Want more analyses? Consider upgrading to a paid plan
→ Ready to analyze? Visit your trading platform and click "Analyze this chart" to get started!
Weekly Market Flow Report
Institutional positioning & smart money flow — free during beta.
- ✓Smart Money Flow — track what institutions are buying & selling
- ✓Conviction Scores — clear signals: Bullish, Bearish, Neutral
- ✓Positioning Scenarios — entry triggers & risk guidance for each asset
Gold · Silver · Copper · Bitcoin · Crude Oil · S&P 500 · Nasdaq